Statistics: Measures of Central Tendency#
Definitions#
Measures of Central Tendency: Statistical measures that describe the center or typical value of a dataset.
Overview#
Measures of central tendency provide a summary statistic that represents the entire dataset, making it easier to understand and interpret data.
The three most common measures of central tendency are:
Mean
Median
Mode
Mean#
The mean, often referred to as the average, is calculated by summing all values in a dataset and dividing by the number of values.
Formula:#
For a population mean (\(\mu\)):
For a sample mean (\(\bar{x}\)):
Where:
\(N\) = number of units in the population
\(n\) = number of units in the sample
\(x_i\) = each individual value in the population/sample
Note: There is a distinction in notation between the population mean, \(\mu\), and the sample mean, \(\bar{x}\). This is because \(\mu\) is a population parameter and \(\bar{x}\) is a sample statistic or estimator for \(\mu\).
Example:#
For the sample dataset \(\{4, 8, 6, 5, 3\}\):
Median#
The median is the middle value of a dataset when the values are arranged in ascending or descending order. If the dataset has an odd number of observations, the median is the middle number. If it has an even number of observations, the median is the average of the two middle numbers.
Steps to Find the Median:#
Arrange the data in order.
If \(n\) is odd, the median is the value at position \(\frac{n + 1}{2}\).
If \(n\) is even, the median is the average of the values at positions \(\frac{n}{2}\) and \(\frac{n}{2} + 1\).
Example:#
For the dataset \(\{4, 8, 6, 5, 3\} \ (sorted: \{3, 4, 5, 6, 8\})\):
Odd:
Median = 5 (the third value)
For the dataset \(\{4, 8, 6, 5\} \ (sorted: \{4, 5, 6, 8\})\):
Even:
Median = \(\frac{5 + 6}{2} = 5.5\)
Mode#
The mode is the value that appears most frequently in a dataset. A dataset may have one mode (unimodal), more than one mode (bimodal or multimodal), or no mode at all.
Example:#
For the dataset \(\{4, 8, 6, 5, 3, 4\}\):
The mode is 4 (it appears twice).
For the dataset \(\{1, 2, 2, 3, 3, 4\}\):
The dataset is bimodal with modes 2 and 3.
Comparison of Measures#
Mean: Sensitive to extreme values (outliers) and skew.
Median: Robust measure that provides a better representation when the dataset contains outliers.
Mode: Useful for categorical data or to identify the most common value.
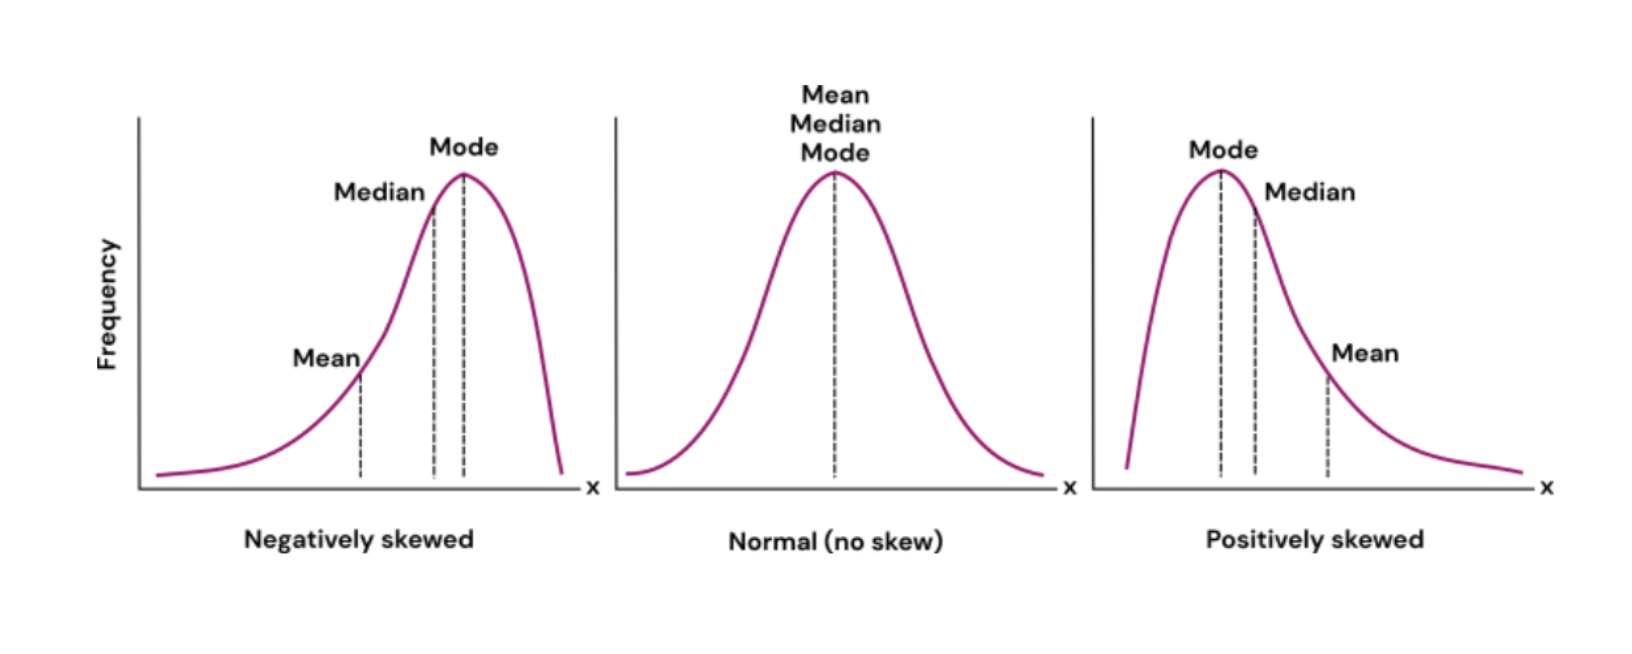
Image Source: https://ledidi.com/academy/measures-of-central-tendency-mean-median-and-mode