Statistics: Populations & Samples#
Definitions:#
Population: The complete set of units or individuals of interest (i.e., the entire group we want to draw conclusions about).
Sample: A subset of the population, ideally selected randomly and sufficiently large to be representative.
Note: “Population” is contextual; it won’t always mean everyone in the world. We could mean the American population, the European population, the population in Tompkins County, or the population of graduate students at Cornell. In any case, the “population” is the highest unit of generalizability.
Statistical Inference: The process of drawing conclusions about population characteristics using data from a sample.
Parameter: A numerical value that describes some characteristic of a population (e.g., mean, variance, proportion).
Statistic: A numerical value computed from a sample that estimates a corresponding population parameter.
Sampling#
Sampling is the mechanism by which we can find generalizable truths about the world around us. Specifically, random sampling drives statistical inference.
We take samples of a target population to estimate population parameters:
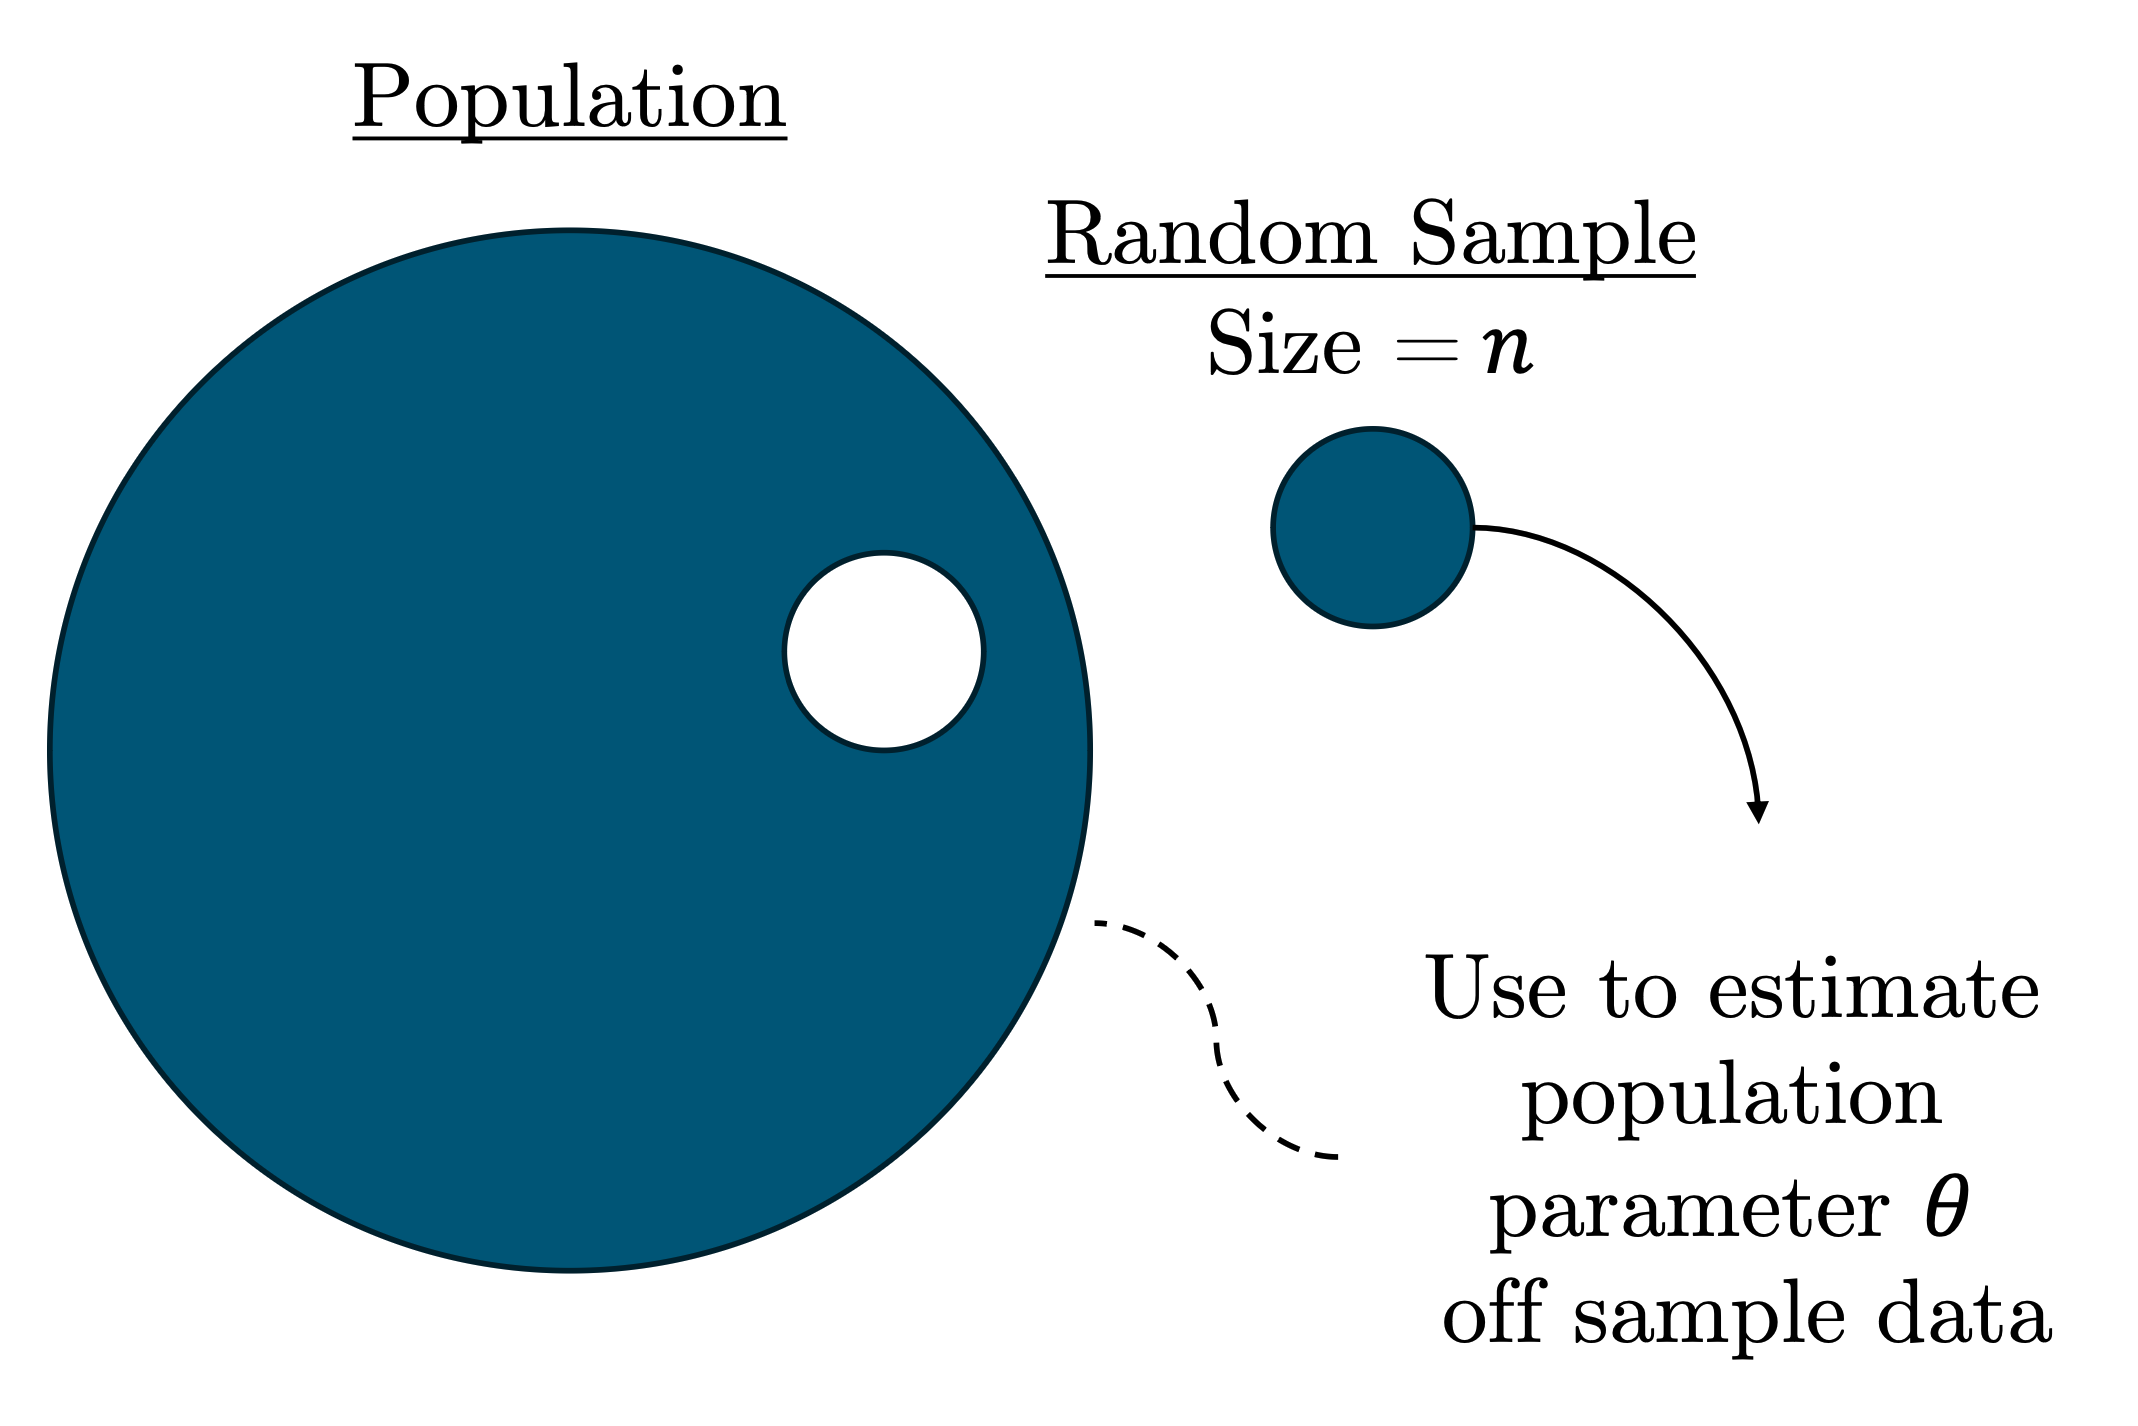
In technical terms, we denote the sample size, or the number of units in our sample (e.g., people), by the letter \(n\) and the sample as the series:
where each \(x_i\) is an individual unit from the population.
Sampling With Replacement#
There are two overarching methods of sampling: sampling with replacement and sampling without replacement.
Sampling with replacement means that subjects may be sampled, recorded, then reintroduced into the population pool of possible subjects for sampling (replaced).
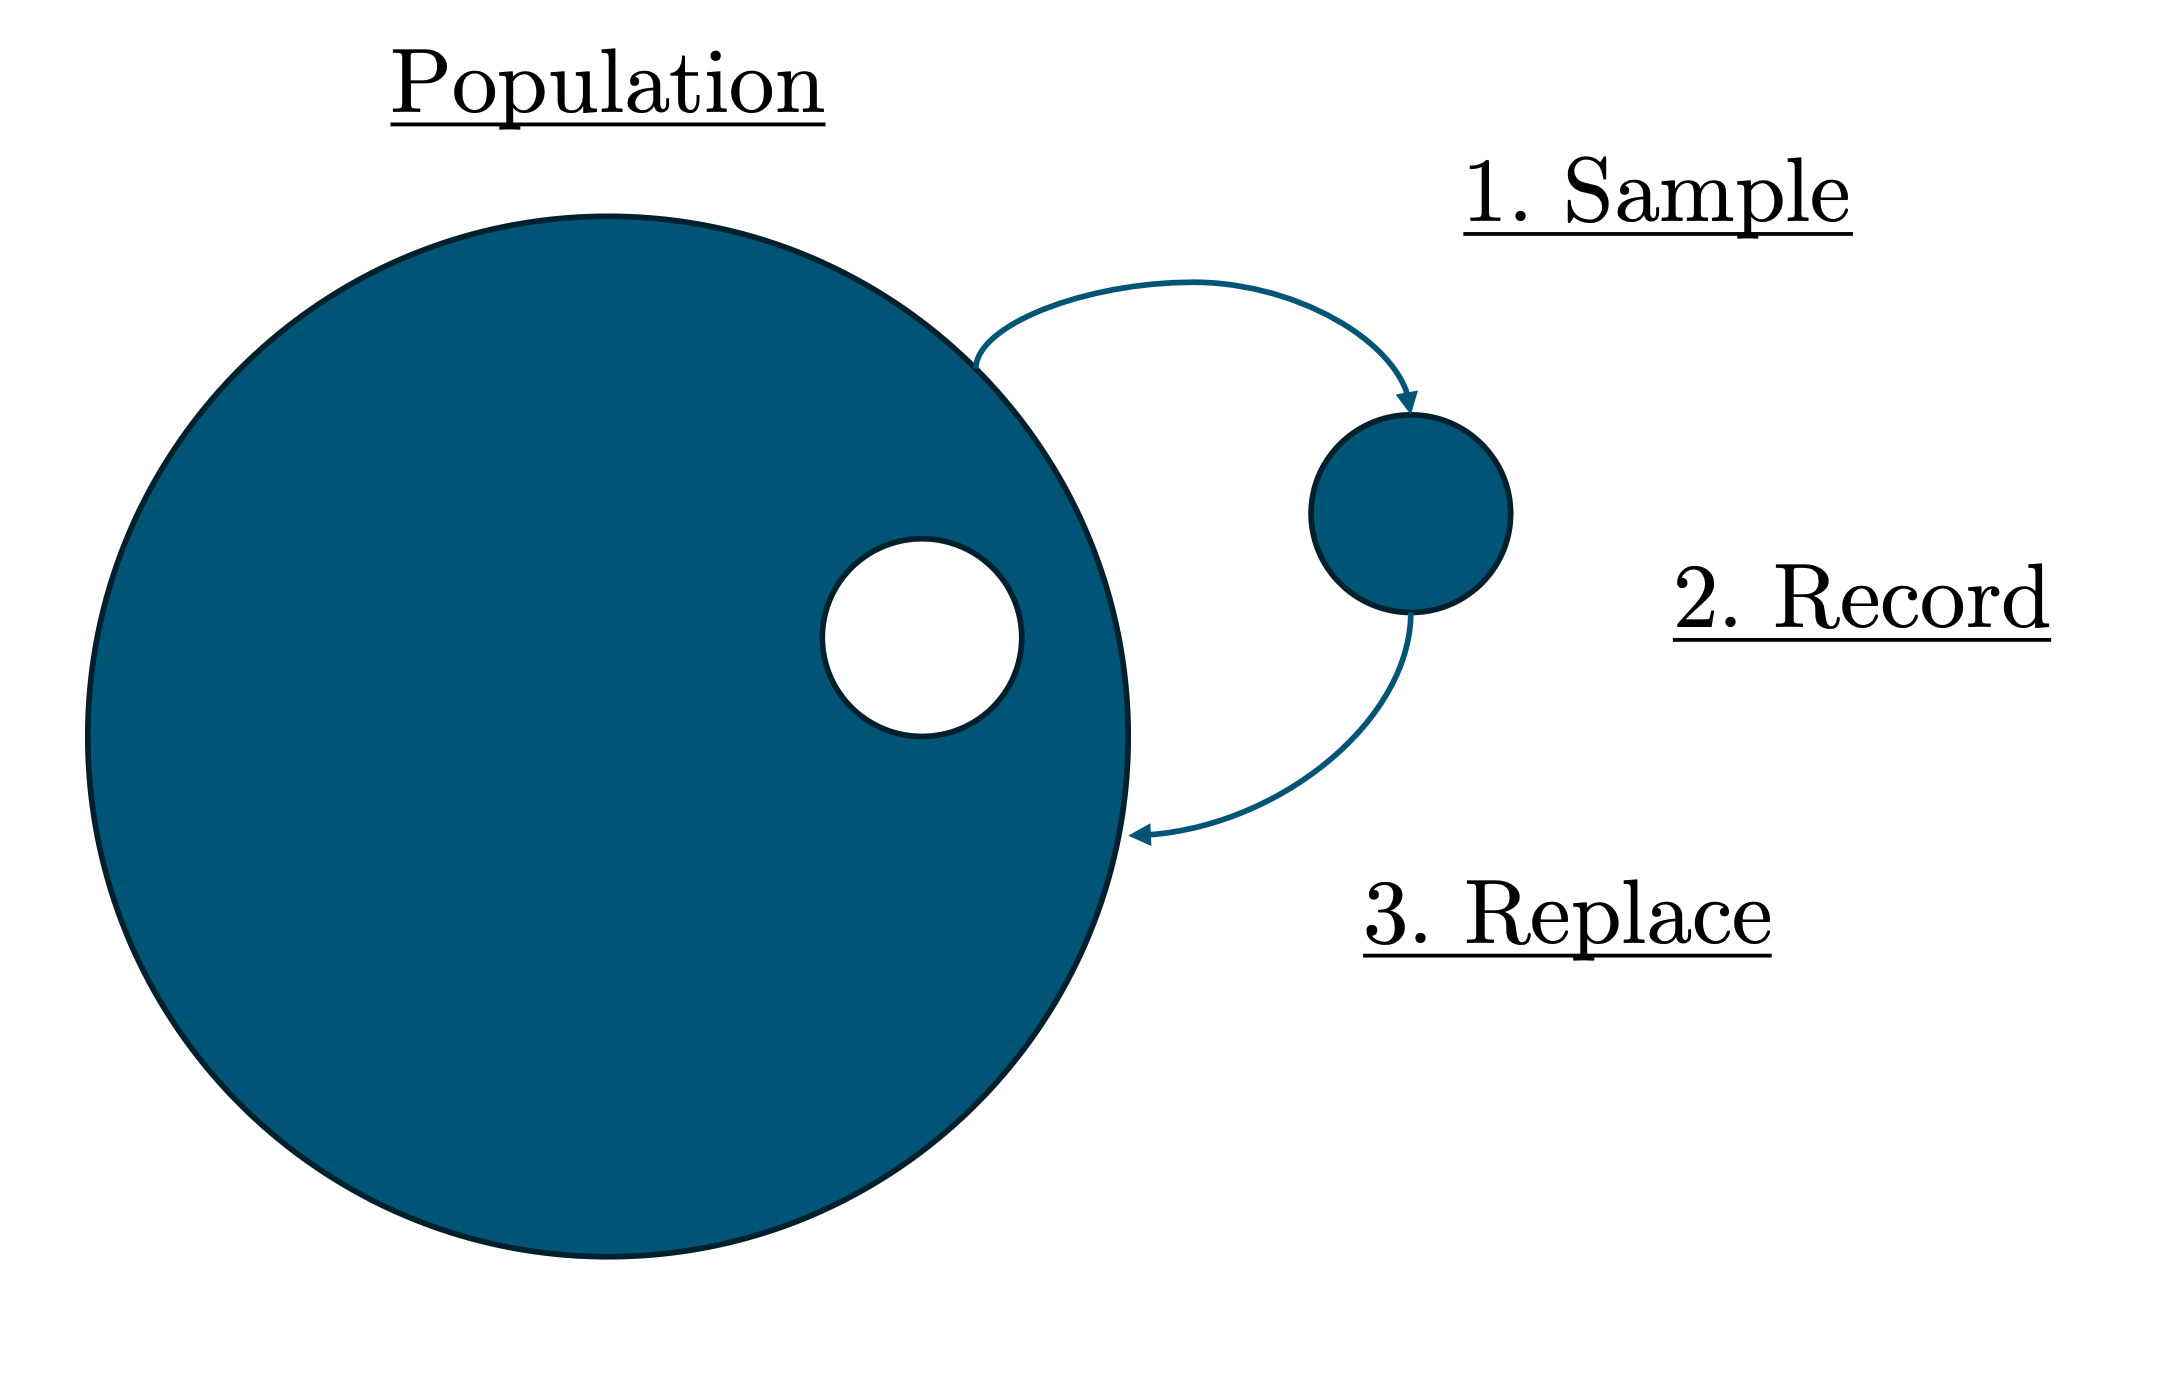
We can conceptualize this with an example: Say you want to sample 30 students from the 275 undergrads in the Brooks School. When you select a student, they had a 1/275 chance of being picked. Replacement means that, after you record them, you reintroduce them into the pool to maintain the pool size at 275.
Replacement, then, means every unit has an equal chance of being selected in the sample irrespective of who else gets chosen (i.e., you being sampled doesn’t change that my chance of being selected is still 1/275). It also means units sampled and replaced have an equal chance of being reselected.
Independence & IID#
Sampling with replacement produces some powerful properties in inferential statistics, namely independence and identical distribution.
Independence is when the outcome of one event does not influence or affect the outcome of another event. I.e., you being selected for the sample doesn’t change my chance of being selected.
Identical distribution means that all observations come from the same population; that all data are generated by the same process.
Together, these two conditions form a property known as IID, which states:
“A series \(\{x_1, x_2, \dots, x_n\}\) is independently and identically distributed (IID) if each \(x_i\) is drawn independently from the same distribution.”
IID is a bedrock precondition for much of statistical inference, supporting fundamental theorems like the Law of Large Numbers and the Central Limit Theorem. More on this in the Probability section.
Note: While IID sampling allows clean theoretical properties, it also opens the door for repeated sampling of the same units, which may reduce sample diversity or introduce bias. Remedies include increasing sample size, using stratification, or applying bootstrap resampling techniques appropriately.
Sampling Without Replacement#
More often than not, however, we will find ourselves sampling without replacement, which is when we sample and record a subject but don’t reintroduce them into the pool of possible subjects for sampling. To extend the previous example, every time we select an undergrad, the next student’s probability of being selected is \(\frac{1}{n-1}\); if you got selected with a 1/275 probability of being chosen, now my probability is 1/274 because you are taken out of the pool and cannot be reselected.
The reason it is more common to sample without replacement is practicality. Where in social science research, we are often dealing with finite, well-define populations, there are a multitude of reasons why we might not want to sample or survey the same individual multiple times. It may skew results and affect how representative the sample it; it may produce less diverse units in the sample; repeated sampling may contribute to respondent fatigue and non-response; etc.
In any case, sampling without replacement does raise concerns about independence at smaller scales. With a population of 10, the difference between having a 1/10 and 1/9 chance of being selected is large relative to the difference between having a 1/1,000,000 and 1/999,999 chance of being selected. But, at smaller scales, it’s feasible to forego sampling to estimate a population parameter altogether and conduct a census to find the true parameter value.
When populations are large (e.g., the population of California, Maricopa County, or even the City of Ithaca), the effect of no replacement is nominal (e.g., the difference between a 1/1,000,000 and 1/999,999 chance of being selected), meaning independence effectively holds. IID, then, is often still applicable, allowing us to still carry on with statistical inference, though always with added caution.
Sampling Strategies#
There are various methods of actually conducting a random sample. Below are some of the most common sampling strategies and a brief description of how they’re conducted:
Simple Random Sampling (SRS):#
Each individual in the population has an equal chance of being selected. This can be done with or without replacement.
Stratified Sampling:#
The population is divided into subgroups (strata) based on shared characteristics, and samples are drawn from each stratum. This ensures representation across key segments.
Cluster Sampling:#
The population is divided into clusters (often geographically), and entire clusters are randomly selected. This method can be more practical and cost-effective in certain situations.
Systematic Sampling:#
A sample is drawn by selecting every \(n\)-th individual from a list or queue after randomly selecting a starting point.
Multistage Sampling:#
A combination of sampling strategies, such as first selecting clusters and then conducting SRS within those clusters.
Population Parameters & Sample Statistics#
Sampling is done with the intent to estimate an unknown population parameter without having to record every unit in the population. Mechanically, then, it’s helpful to conceptualize population parameters and sample statistics as two separate entities.
Let’s motivate this distinction with some notation. Let’s say we want to know some parameter (characteristic) \(\theta\) about a population (this could be a mean \(\mu\), for example). From sample data, we estimate the value of \(\theta\) using some estimator \(\hat{\theta}\), or formula defining our approach to estimating the population parameter.
The function \(\hat{\theta}\) is our estimator for the true population parameter \(\theta\), which yields a point estimate \(\hat{x}\), which is the realized value of the estimator \(\hat{\theta}\) and our best guess of the value of the true population parameter.
Note: The distinction between a population parameter and its estimator (i.e., corresponding sample statistic) is as much a notational one as it is a conceptual one. Population parameters have different notational representations than their sample analogues. For example, population means are represented by \(\mu\) whereas sample means are denoted by \(\bar{x}\); population standard deviation is represented by \(\sigma\) whereas sample standard deviation is denoted by \(s\); etc.
Why the Distinction?#
Unless we conduct a census and gather data on the entire population, we will never know the true value of any population parameter. Sample statistic estimators are the best operationalization we have to estimate population parameters (that’s why we even bother developing fields like causal inference: to help us better estimate population parameters). For this reason, it’s best we separate the abstract (population parameters) from the concrete (summary statistics) in our work.
Because estimation from samples is messy and wrought with error, we must often adjust our formulas and functions to fine tune our estimators to produce estimates closer to the true population parameter. Sometimes, the formula for a population parameter will look different than the formula for its sample statistic estimator. Having distinct notation for parameters and their estimators, then, will avoid confusion and improve clarity down the line.